This is part of a series from the unofficial cartographer of Detroit, Alex B. Hill, a self-described “data nerd and anthropologist” who combines mapping, data, and analytics with storytelling and human experience. He is the founder of DETROITographyand author of “Detroit in 50 Maps” and “Great Lakes in 50 Maps.”
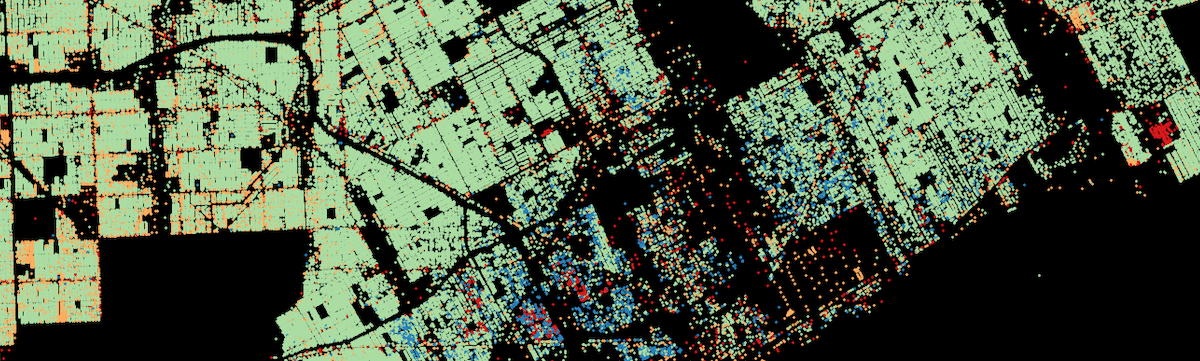
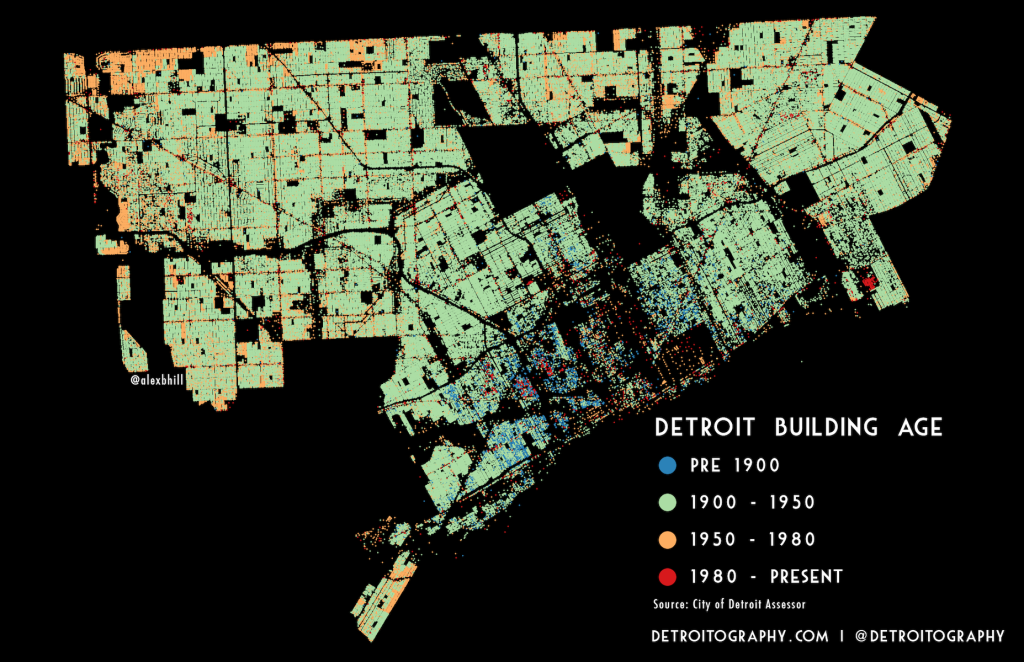
The story of Detroit’s growth and change is beautifully captured through a classic dot density map, where the age of structures across the city’s landscape is visualized. Each land parcel is represented by a centroid — its center point — and assigned a value corresponding to the year a building was originally constructed on that site. This method is effective in offering a broad, intuitive sweep of development patterns, allowing us to account for recently vacated lots (which retain the age of the structure that was there) but with the caveat of not fully capturing parcels that host multiple, distinct buildings.
An initial glance at the map immediately highlights a key trend: a significant portion of more recent construction efforts has been concentrated in areas that were previously less developed or had higher vacancy rates. This pattern is logical, as these are the areas where large-scale development is most feasible. However, this observation is tempered by a crucial spatial detail: the visualization, by reducing large land parcels to a single point location, can inadvertently amplify the visual impact of major institutional or commercial developments, such as a large hospital campus, making a single recent project appear as a dense cluster of “new” points.
What truly captivates the eye, however, is the fascinating spatial dialogue between the city’s oldest and newest structures. There is a very pronounced and intriguing clustering of two distinct time periods — Pre-1900 and 1980-Present — in pivotal, historically rich neighborhoods such as Midtown, the area immediately west of Midtown, and Corktown. This proximity suggests a unique preference in Detroit’s urban regeneration: a desire for the “Old Detroit” and the “New Detroit” to coexist and integrate rather than occupy completely separate zones. The city is not expanding outward and abandoning its core; rather, it’s experiencing a concentrated internal renewal.
This architectural confluence is perhaps nowhere better exemplified than in Brush Park. This neighborhood has become the quintessential model for the city’s blend of past and future. Here, beautifully preserved and painstakingly renovated historic Victorian mansions stand shoulder-to-shoulder with striking examples of “city modern” redevelopment, often executed by major local developers like Bedrock. The blending of these two architectural epochs in Brush Park and the surrounding core neighborhoods illustrates a commitment to preservation and a bold vision for the future, ensuring that the legacy of Detroit’s industrial and architectural prime informs, and is integrated with, its 21st-century resurgence. The map thus serves as a powerful visual testament to the philosophy that the city’s history is its greatest asset in building its future.
Author

Related Articles
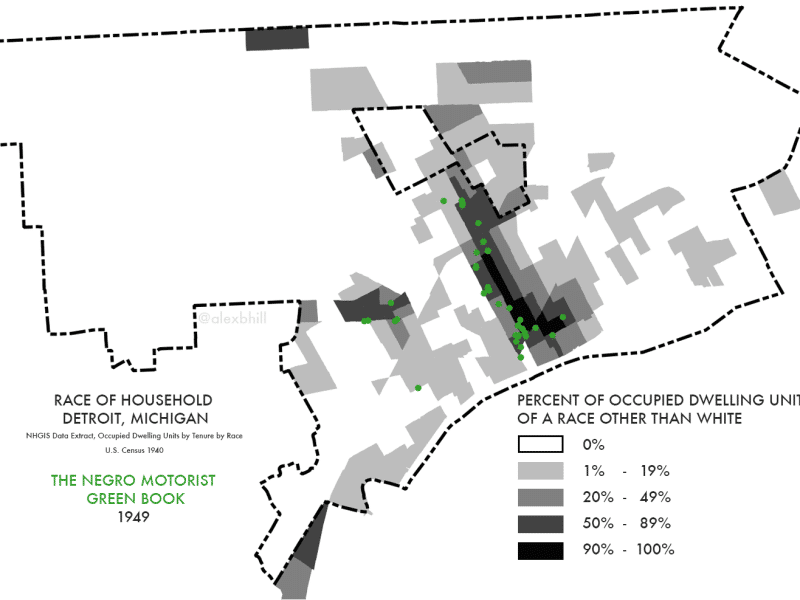
Mapping Detroit: Green Book Locations
Green Books mirrored the state of discrimination, racism, and African American rights in the nation each year. Detroit’s listings started in 1938.

3+13 Ways to Celebrate 313 Day in Detroit
March 13th — known locally as 313 Day — is Detroit’s unofficial holiday celebrating the city’s area code, culture, and community pride.

Travel + Leisure Names Detroit, “Most Underrated City” in Midwest. Here are 5 Gems We Think Were Missed
Detroit’s renaissance is happening in every corner of the city, often in places that fly just a little under the radar. At Model D, we’ve had the chance to cover many of those emerging spaces, projects, and entrepreneurs shaping Detroit’s future. Here are five Detroit gems we think deserve a spot on any “underrated Detroit” list.

