Mapping Detroit: How does one map occupancy in the city, anyway?
The known crises of low home mortgage origination, large-scale evictions, and property speculation make Detroiters unduly mobile, having to secure housing by various means and face multiple barriers along the way.
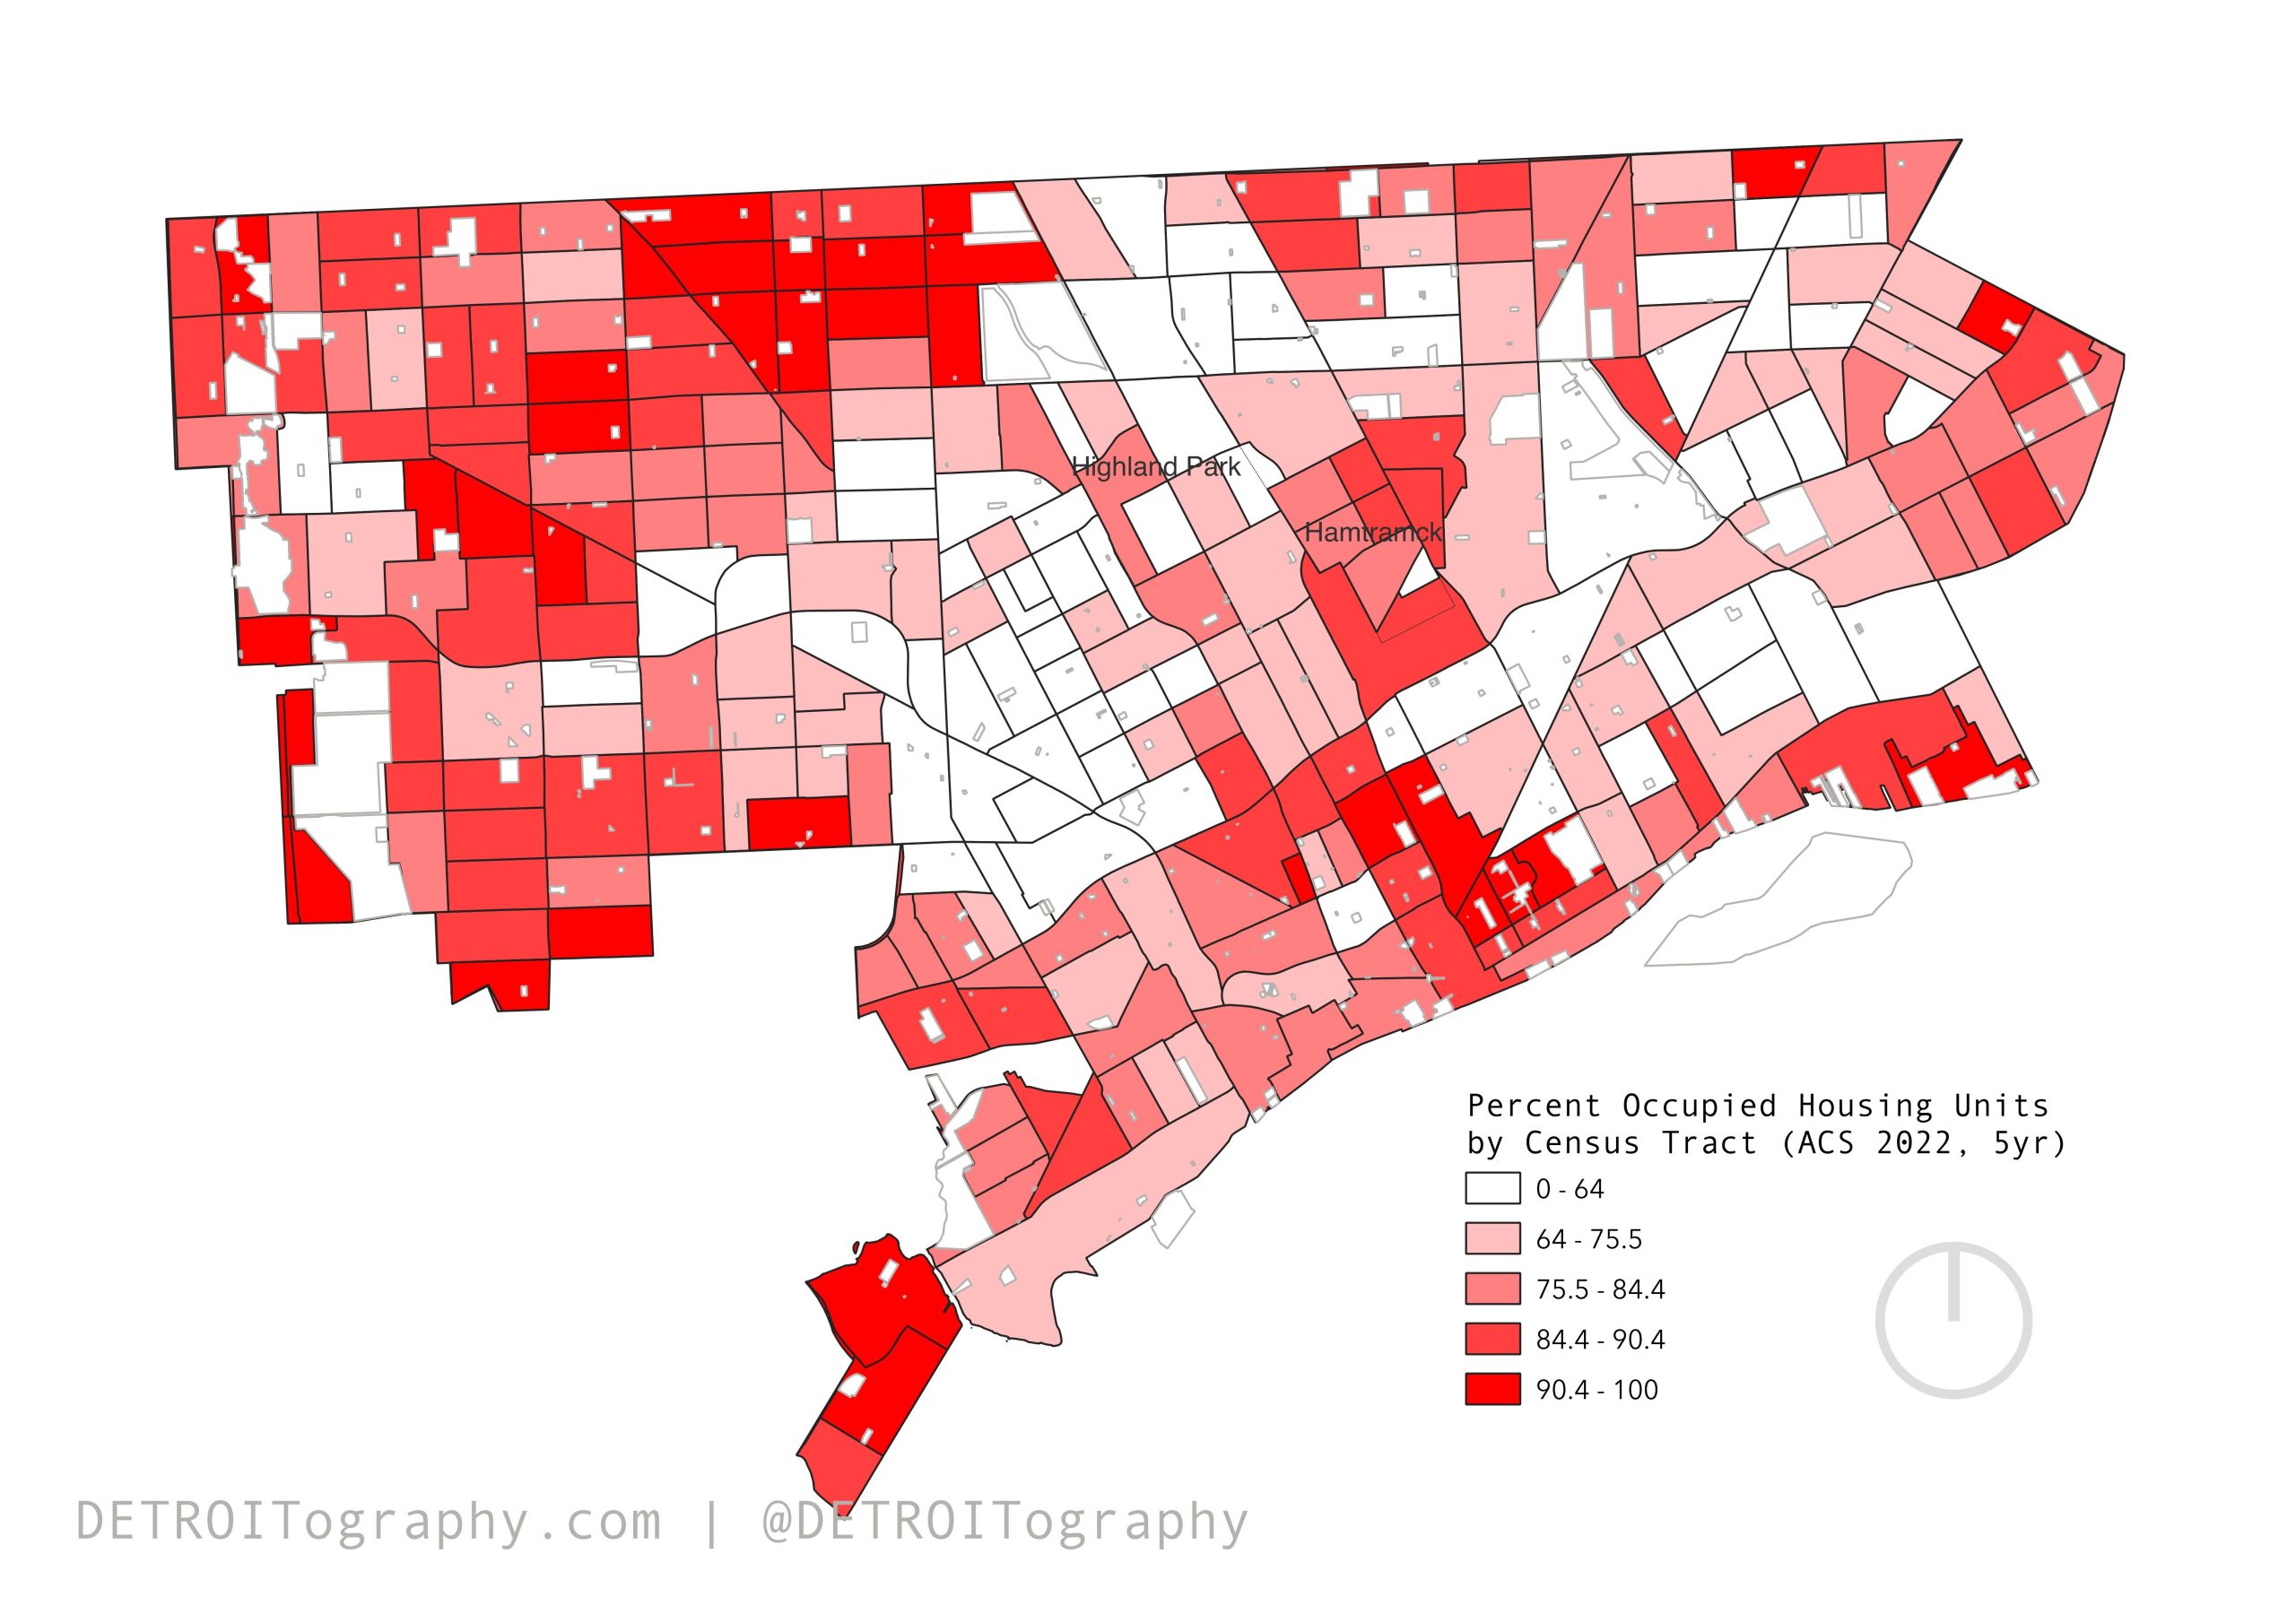
Understanding occupancy and vacancy in Detroit is a constant battle in comprehending data. The known crises of low home mortgage origination, large-scale evictions, and property speculation make Detroiters unduly mobile, having to secure housing by various means and face multiple barriers along the way.
The last subjective assessment of occupancy in Detroit came with the 2014 Motor City Mapping project, but relied on responses of surveyors. The City’s current in-house “Detroit Street View” imagery could be used to do the same, but might not capture indicators like utility turn-ons. The Detroit Land Bank Authority used to run a quarterly “occupancy index” model that included DTE account information to better assess occupancy, but as far as I have heard, the data-sharing agreement fell apart years ago.
The next best option is Census data on occupied housing units or USPS data on vacancy. I try to opt for the more positive data indicator with where people are in housing. We see a familiar pattern that maps onto the population dense clusters across the city.
Author

Related Articles

Juneteenth: Freedom’s promise is still denied to thousands of blacks unable to make bail
Just as with so many other criminal justice policies, pretrial detention disproportionately affects African-American men and women, destabilizing black families in the process.

Michigan Adventurer to Bike 1,000 Miles Across State to Spotlight Hidden Form of Domestic Abuse
A Michigan adventurer is biking over 1,000 miles across both peninsulas this summer to raise awareness about economic abuse: a hidden form of domestic violence that affects countless survivors across Michigan.

Detroit schools are making real gains in reading and math: 4 strategies that are working
The city’s schools are making progress faster than peer districts, but that progress could be fragile.
